Fuzzy Threshold Power FTP
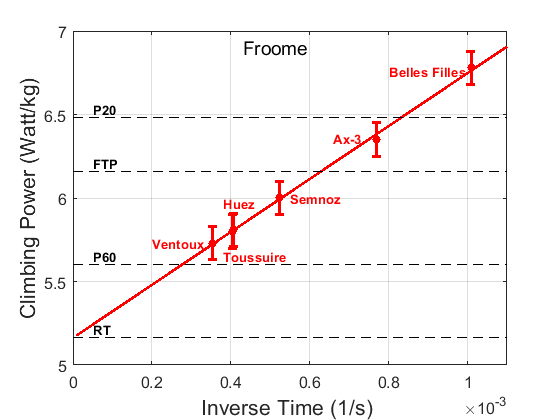
The TDF 2012 and 2013 had 6 finishes on top of well known climbs. On these climbs Froome had to produce his best performance to try winning the stages and/or the tour. These climbs are La Planche des belles Filles, AX-3 Domaines, Semnoz, Alpe d’Huez, La Toussuire, Ventoux (last 15 km). Because Froome or Sky never disclosed any powerdata we computed his average power on these climbs considering as best as possible all parameters such as climbing time, detailed climbing profiles, Froomes weight, length, weather conditions, influence of drafting, average altitude. These average climbing power versus the inverse of climbing time are shown in next graph. Because these data may be considered real maximal performances in the time window 12 minutes to almost 1 hour, they give insight into the Slow Death zone of this great champion and accidently into the real meaning of FTP with relation to its definitions or assumed relation to maximal performance over 20 minutes.
The definition of Functional Threshold Power FTP was given bij Allen and Coggan as “ The highest power that a rider can maintain in a quasi-steady state for approximately 1 hour without fatiguing “ . Because there is a lot of fuzziness in this definition we prefer to refer to P60 as being “The highest average power a rider can maintain during 1 hour”
Because it is not easy to perform reliable tests over 1 hour, Allen and Coggan proposed a test over 20 minutes P20 and stated that FTP is equal to 95% of this P20 value. This FTP = 0.95 P20 rule was adopted by many users, books, coaches, coaching platforms and has earned a Sacred Cow status, altgough it was never verified, makes no distinction between riders and implies that all riders have identical metabolism, disregarding age, sex, muscle composition, anaerobic capacity, training, mechanical efficiency etc…
Therefore let us compare all these stated power thresholds for this one particular great champion, 4 times winner of the Tour de France
This figure shows the best performances of Froome as red dots with a corresponding model linear regression fit. From this linear regression the 4 different power reference values are computed, of which RT is the one and only 1 real threshold. RT marks the onset of anaerobic contribution and onset of lactate production.
Recovery Threshold RT = 5.17 W/kg
Best 1 hour power P60 = 5.60 W/Kg
FTP as 0.95 of P20 = 6.16 W/kg
P20 = 6.48 W/kg
Ratio P60 : P20 = 0.86
It is clear that FTP as 95% of P20 is very far from being equal to the P60 value. Instead P60 is 86% of P20
Of course this result is specific for Froome and we may ask if it is valid for other riders.
A scientific study at the University of Calgary - Canada (Inglis et al. 2020) using 18 participants found that the avarage power at Maximal Lactate Steady State MLSS is equal to 88 % of P20, with a rider-dependent statistical variation of 5%.
Because it is generally accepted that MLSS is sustainable for approximately 1 hour we may conclude that Froomes ratio P60:P20 is well within the results expected from this study.
We therefore conclude that
1. If FTP is intended to be sustainable during 1 hour, it should be approximately 88% of P20.
2. Using the 95% rule will grossly overestimate FTP
3. Training zones should not be based on any single fuzzy FTP estimate
4. Generally it is unwise to define training zones on the basis of FTP or any other single reference power.

